Linux Performance Tools
Mainly about what can be done
General Methodology
Start with questions before tools.
A simple scenario
start with a problem and the steps follow like
- A program is running slow.
- Run
top - Turns out not showing.
- So it is not on CPU?
iotop,iostat -x 1?netstat -s,netstat -i,ss?
It is better to first get the basics before trying out all these
- what is the problem
- does it worked as intended before
- what does the program do?
getting these clear first is much better than random guessing
Tools: Observability
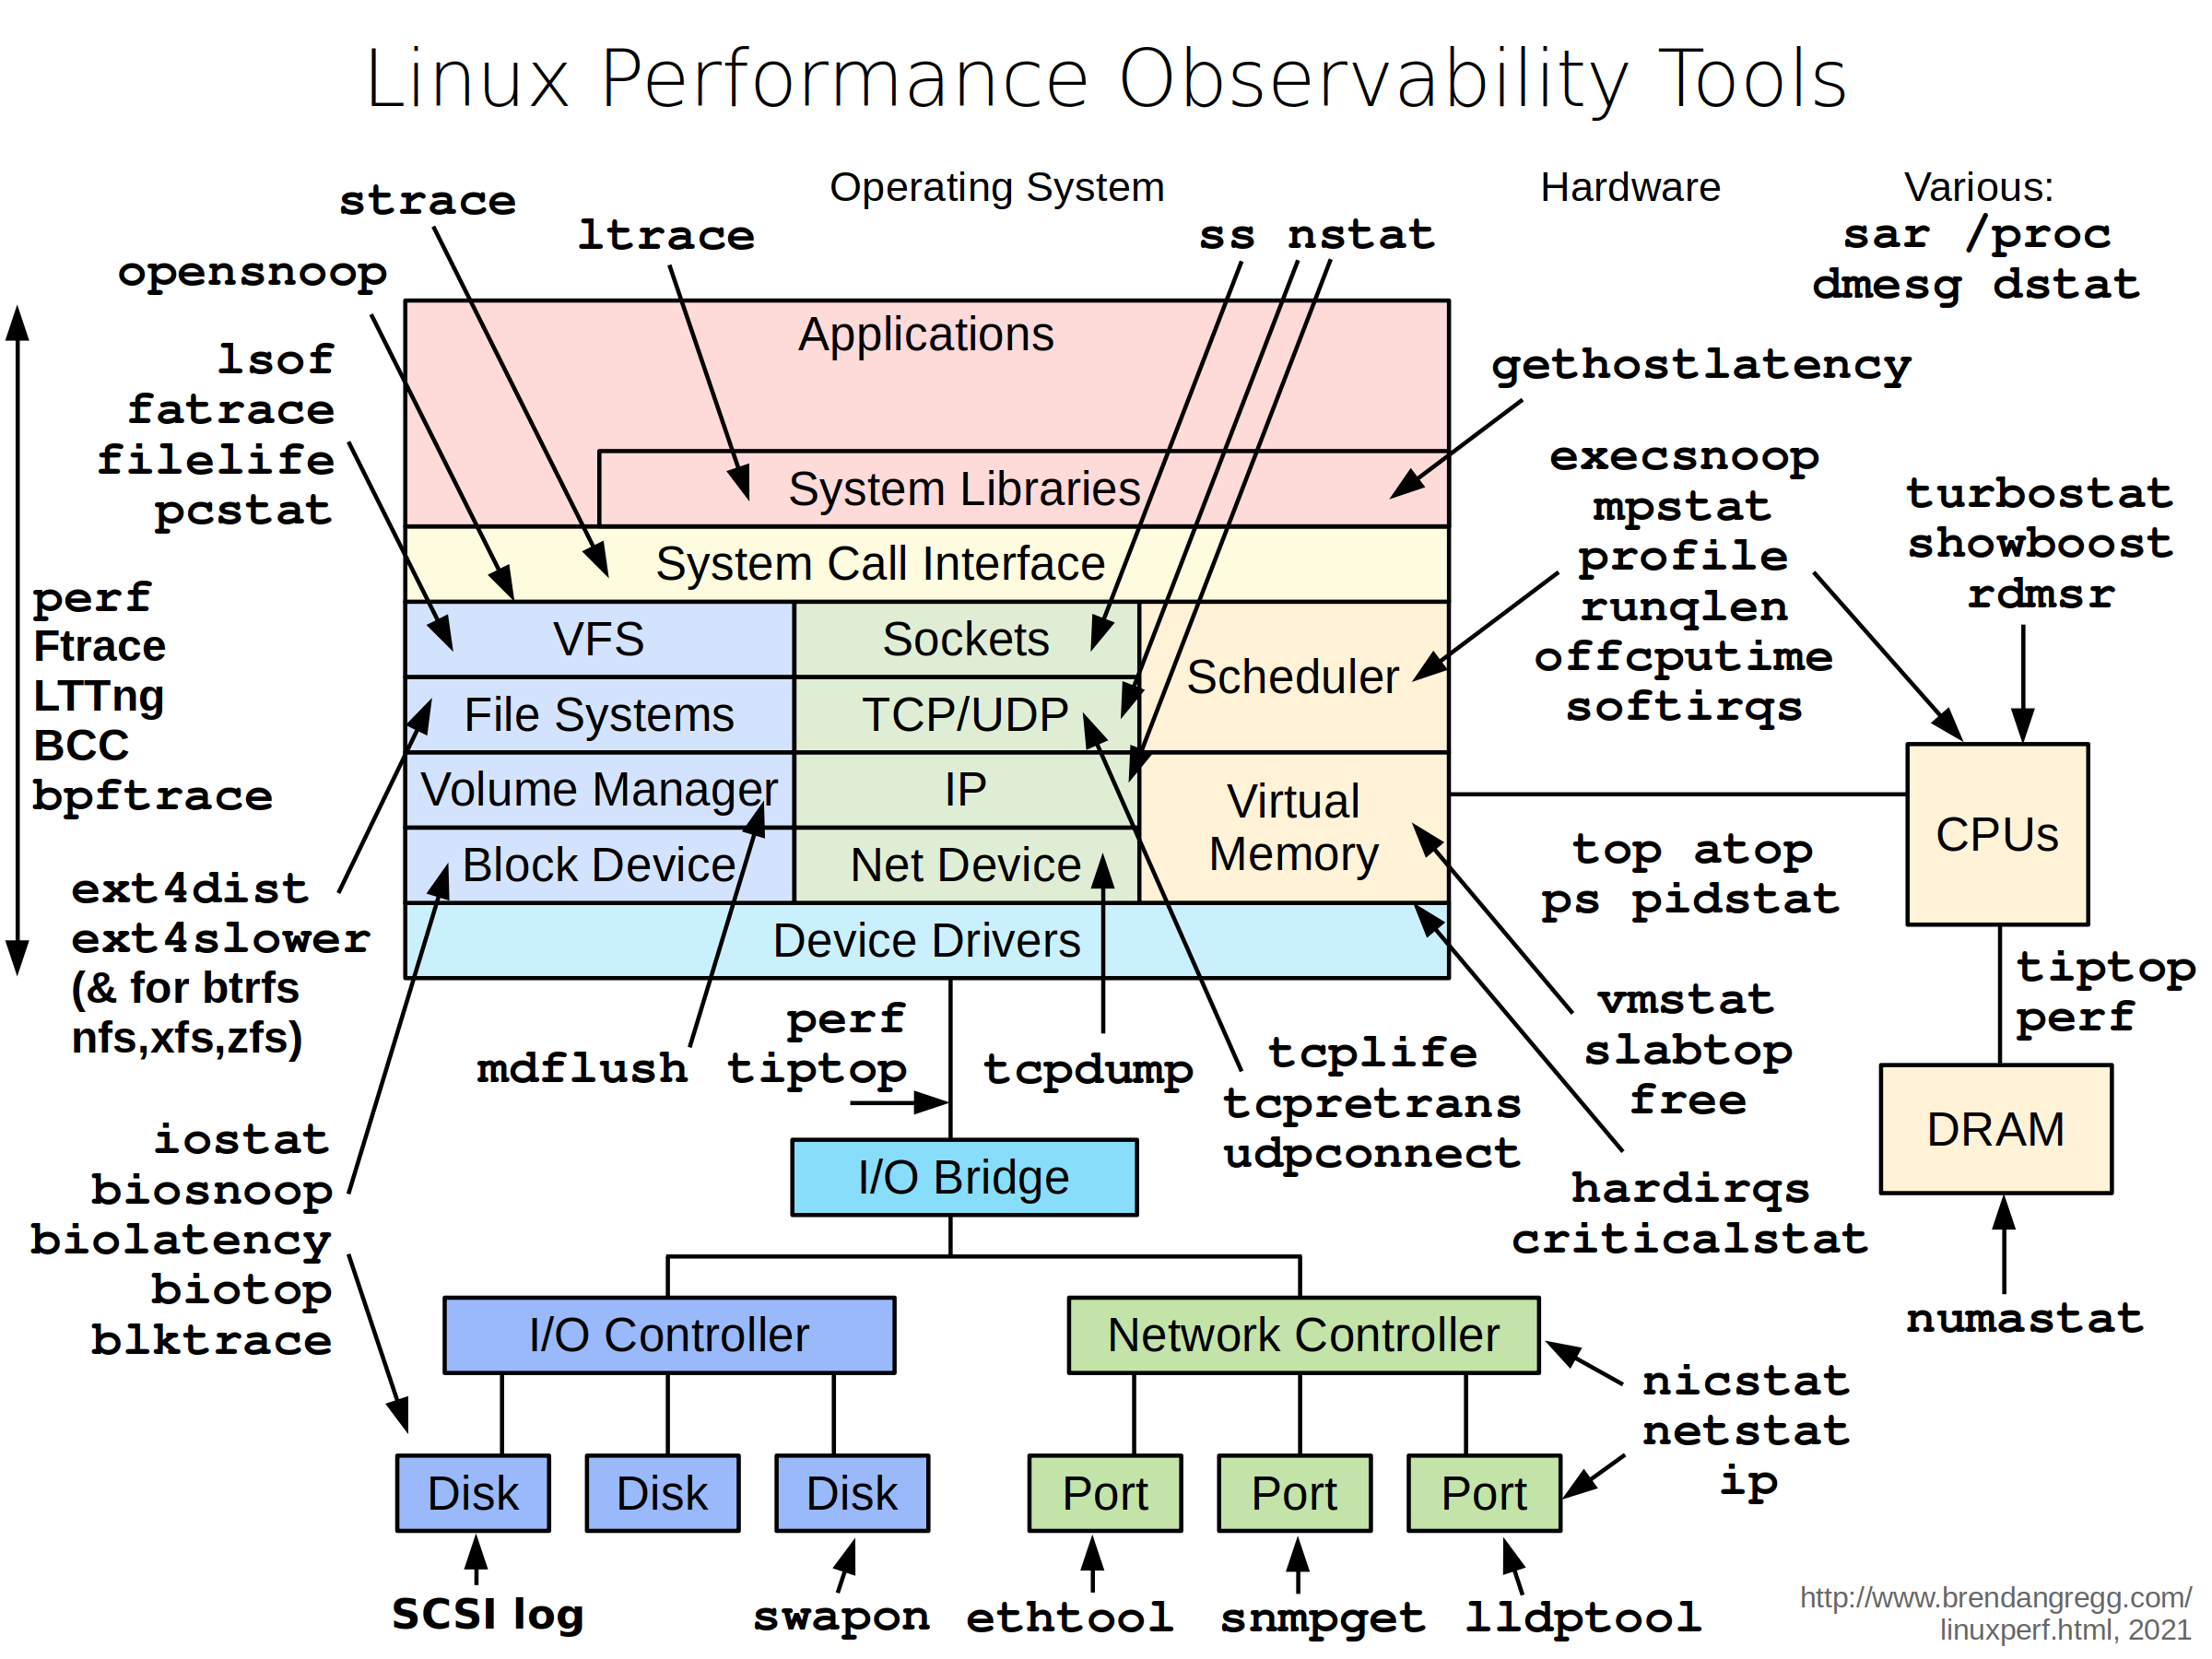
Basic
- uptime
- top
- ps
- vmstat
- iostat
- mpstat
- free
I would say we can think of 4 four resources. CNMD (Sorry my friend if you happen to know Chinese, CNMD is not a good name, but it memorizes so well): CPU, Network, Memory and Disk
CPU
uptime: load avg for 1, 5 and 15 minutestop: live process list, press 1 for per core view and P to sort by CPU.mpstat -P ALL 1: CPU usage per core (-P ALL) with 1 second interval (1)pidstat -t 1: process stats (per-thread, disk IO), with 1 second intervalps aux --sort=-%cpu | head: snapshot of all processes (aux) sorted by CPU usage descending (–sort=-%cpu) top 10 only (head)vmstat 1: run queue length and CPU time split with 1 second interval (1)
Network
sar -n DEV 1: per-interface throughput (-n DEV) with 1 second interval (1)ss -s: summary of socket counts by state (-s)ip -s link: per-interface statistics including errors and drops (-s)netstat -s: per-protocol counters such as TCP retransmits (-s).- it can also do
-i(interface),-r(route table),-p(process detail) and-c(per c second interval)
- it can also do
tcpdump -i <intf> -w <file>: packet sequence with timestamps.
Memory
free -m: memory and swap totals in megabytes (-m)vmstat 1: swap in/out activity with 1 second interval (1)top: live process list, press M to sort by resident memoryps aux --sort=-%mem | head: snapshot of all processes (aux) sorted by memory usage descending (–sort=-%mem) top 10 only (head)
Disk
iostat -xz 1: per-device I/O with extended stats like latency and %util (-x), skipping idle devices (-z), with 1 second interval (1)vmstat 1: blocks read/written and CPU iowait with 1 second interval (1)ps -eo state,pid,cmd | awk '$1=="D"': all processes (-e) showing state, pid and command only (-o state,pid,cmd), filtered to state D meaning blocked on I/O (awk)pidstat -d, for disk IO blocktop: live view, the wa field shows CPU time lost to disk waits
Tools: Benchmarking
The issue of benchmarking is that, most of time, you wont be able to measure the right thing. So really needs to be careful.
unixbench, imbench, sysbench, perf bench
FS/Disk: dd, hdparm, fio
App/lib: ab, wrk, jmeter, openssl
networking: ping, hping3, iperf, ttcp, traceroute, mtr, pchar
Tools: Tracing
Easy (front-end) tools:
- strace
- execsnoop
- iosnoop -ts
- iolatency
- opensnoop
- tpoint
- funccount
- funcgraph
Proper:
- ftrace
- perf_events
- eBPF
- systemtap
- LTTNG
- …
too many choices.
But me myself am more comfortable with userspace instrumented tracing. I think that is
- more likely to measure the right thing
- more info
Reference
Linux Performance Tools, Brendan Gregg, O’Reilly Velocity conference 2015 Santa Clara